 . It consists of a
collection of explicit XML style files for mapnik rather than generating them
from more high-level descriptions and is therefore more suitable for seeing
what is going on.
. It consists of a
collection of explicit XML style files for mapnik rather than generating them
from more high-level descriptions and is therefore more suitable for seeing
what is going on.
| ↑ OpenStreetmap Hacker's guide | ↑↑ Net & Web |
OSM style overview -- Place names -- Change road colour -- New symbols -- Choose zoom level
The first, easiest step in developing a custom map style is tweaking what is
already there. Here we will start out from the old standard OpenStreetmap
style that can be obtained
here. It consists of a
collection of explicit XML style files for mapnik rather than generating them
from more high-level descriptions and is therefore more suitable for seeing
what is going on.
Below is an overview of the XML files making up the standard style, how they
include each other, and what they contain. If you want to modify an existing
map feature, look here where to find its definition. If you want to add a
feature below certain existing layers and on top of others, you cannot go by
the order in which the included files reference each others: Most assign the
content of other files to XML
entities (constants) that are expanded in the main style file. The order of
expansion is what matters.
Place names in the OpenStreetmap standard style are on the small side, to fit on smartphone screens, and have strict no-overlap requirements that sometimes prevent printing all of them. In this section we will change three things about place names: We will increase the font size, remove the no-overlap constraint and reorder them so that larger place names are on top.
As can be seen from the list above, place names are drawn by the style file inc/layer-placenames.xml.inc. It contains two kinds of top-level tags, Style and Layer. The Style tags contain rules with TextSymbolizer tags that describe how to print them. Multiple rules exist for multiple map scales / zoom levels. The Layer tags describe the data source containing the place names, and their order is the drawing order &emdash; the last layer is on top.
Changing the font size is as simple as changing the size attribute of the TextSymbolizer tag, which is the font size in pixels. I prefer a font size that is ≈ 1.3 times the original, and have also changed some sizes that were the same for different zoom levels. A patch for this and the following changes is here.
To allow place names to overlap, we have to add the attribute
allow-overlap="true" to the TextSymbolizer tags. This is documented in
the corresponding Mapnik
wiki page.
Finally, to overwrite small place names with larger ones, we have to reverse the order of the Layer tags in inc/layer-placenames.xml.inc. While we are at it, we can also raise all place names higher in the drawing stack by moving the line &layer-placenames; in osm.xml to the bottom before the closing </Map> tag. Then place names overwrite icons that are otherwise placed on top.
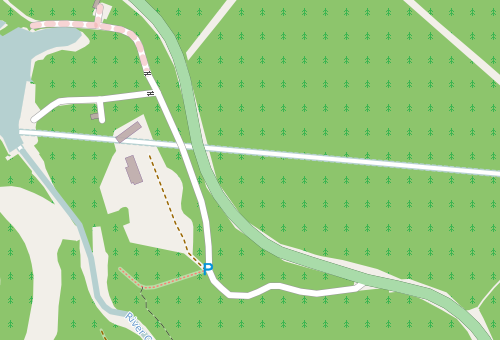
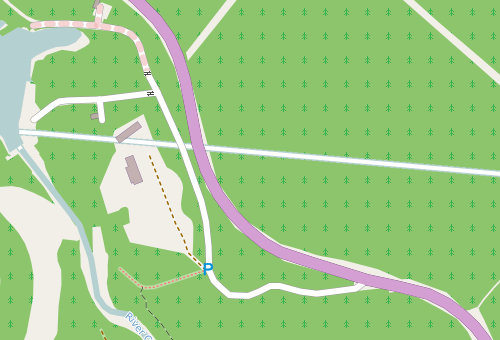
The old standard OpenStreetmap style renders trunk roads in green, which is unfortunate as it has a low contrast with surrounding forests. In this section we will replace that with violet.
Roads are described in the main style file, osm.xml. Three different colours are involved with rendering roads: The fill colour, the "casing" colour and a paler fill colour for tunnels. The fill colours apply to the bulk of the road surface, while the casing colour is for producing darker edges. The casings are drawn by drawing a slightly wider road in casing colour in a lower layer first, before the interior is drawn on top.
Changing the colour is as simple as replacing the value of the stroke attribute of the LineSymbolizer tags that draw the roads. Fortunately, nothing else in osm.xml has the same colours, so you can just make the following replacements globally:
#a9dba9  ->  #d4a0d4
#477147  ->  #6c406c
#cdeacd  ->  #eac0ea
Here is a rendering example:
This map section happens to contain no road number. For consistency we should
also update the colour of the "shield" images in the symbols folder that
carry the road number. This is easier than one might think &emdash; the
following GraphicsMagick command line
performs a colour space transformation that replaces shades of green by shades
of violet:
gm convert symbols/tru_shield4.png -recolor "0 1 0, 0.5 0 0.5, 0 1 0" /tmp/tru_shield4-violet.png
The command preserves transparency, so the round shape of the shield is not changed. After converting all eight shields (which have different widths) and replacing them with the conversion result, you have a consistent trunk road colour.
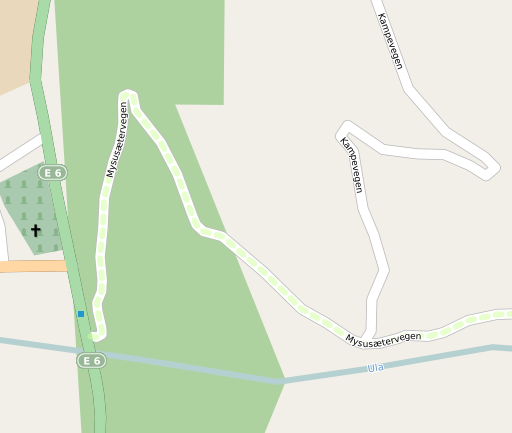
The OpenStreetmap database contains more information than is rendered by the standard style. For example, many of the smaller roads in Norway are toll roads paid for at unmanned toll points. You might want to know that in advance to have change ready and want to display the toll points on your map. (Update: Since I wrote this, toll booth symbols have been added to the OpenStreetmap web map, so perhaps someone has been reading this ;). It is still a useful simple example for how to add point features to a map style.)
To add a symbol, you first need to draw the symbol. I chose a red dollar sign for the toll stations. Each map element specification has two parts &emdash; the Style tag describing what it looks like and the Layer tag drawing it. The relative order of a corresponding Style and Layer tag is not important; but the different layers are drawn in order, so that the last layer is on top.
The simplest toy example for adding this symbol is adding the following code before the final </Map> tag in osm.xml:
<Style name="toll-booth">
    <Rule>
      <PointSymbolizer file="&symbols;/reddollar_s.png" allow-overlap="true" ignore-placement="true"/>
    </Rule>
</Style>
<Layer name="toll-booths" status="on" srs="&osm2pgsql_projection;">
      <StyleName>toll-booth</StyleName>
    <Datasource>
      <Parameter name="table">
        (select * from &prefix;_point where barrier = 'toll_booth') as tolls
      </Parameter>
      &datasource-settings;
    </Datasource>
</Layer>
The Layer references the Style via the StyleName tag. Like the standard map features, the code snippet uses the XML entities symbols (directory where the icons are stored), osm2pgsql_projection (map projection, used frequently), datasource-settings and prefix (database access parameters and table prefix). The Parameter tag contains an SQL query for all toll booths. The parentheses and the suffix as tolls are needed because the query is embedded into another query, though the name tolls does not matter. The result is the map on the right versus the standard style on the left (for a toll road a short distance north of Otta, Norway):

The example above causes the same symbol to be used independently of the map scale. That is not what you normally want &emdash; toll points should not be indicated in very large scale maps, and even when present the symbol sould be larger for smaller scales. The following more complete version uses the scale qualifier entities from entities.xml.inc and two more icons to achieve that:
<Style name="toll-booth">
    <Rule>
      &maxscale_zoom14;
      &minscale_zoom15;
      <PointSymbolizer file="&symbols;/reddollar_xs.png" allow-overlap="true" ignore-placement="true"/>
    </Rule>
    <Rule>
      &maxscale_zoom16;
      &minscale_zoom17;
      <PointSymbolizer file="&symbols;/reddollar_s.png" allow-overlap="true" ignore-placement="true"/>
    </Rule>
    <Rule>
      &maxscale_zoom18;
      <PointSymbolizer file="&symbols;/reddollar.png" allow-overlap="true" ignore-placement="true"/>
    </Rule>
</Style>
<Layer name="toll-booths" status="on" srs="&osm2pgsql_projection;">
      <StyleName>toll-booth</StyleName>
    <Datasource>
      <Parameter name="table">
        (select * from &prefix;_point where barrier = 'toll_booth') as tolls
      </Parameter>
      &datasource-settings;
    </Datasource>
</Layer>
The standard style changes the thickness of roads and the amount of information displayed depending on the zoom level, each of which represents a range of map scales. But this is a compromise in more than one way: The amount of information that could be displayed varies widely between cities and unpopulated regions. Due to the Mercator projection, the map resolution is defined at the equator and will therefore differ between different latitudes by up to a factor of 4. If you render complete map regions, fixing the zoom level saves you the trouble of calculating the right map image size &emdash; rather, you can choose the information you want in the map first and then adapt the image size so it is not too crowded.
You can force the renderer to use the style of a specific zoom level by editing inc/entities.xml.inc, which defines the range of scales corresponding to zoom levels. Simply extend the interval for the zoom level you want and shrink the adjacent ones. The OpenStreetmap style assumes zoom levels to be mutually exclusive, so if the intervals overlap, you will get features from more than one zoom level. For example, the following modification gets you the style of zoom level 13 for a wide range of scales:
...
<!ENTITY maxscale_zoom11 "<MaxScaleDenominator>400000</MaxScaleDenominator>">
<!ENTITY minscale_zoom11 "<MinScaleDenominator>375000</MinScaleDenominator>">
<!ENTITY maxscale_zoom12 "<MaxScaleDenominator>375000</MaxScaleDenominator>">
<!ENTITY minscale_zoom12 "<MinScaleDenominator>350000</MinScaleDenominator>">
<!ENTITY maxscale_zoom13 "<MaxScaleDenominator>350000</MaxScaleDenominator>">
<!ENTITY minscale_zoom13 "<MinScaleDenominator>15000</MinScaleDenominator>">
<!ENTITY maxscale_zoom14 "<MaxScaleDenominator>15000</MaxScaleDenominator>">
<!ENTITY minscale_zoom14 "<MinScaleDenominator>13000</MinScaleDenominator>">
<!ENTITY maxscale_zoom15 "<MaxScaleDenominator>13000</MaxScaleDenominator>">
<!ENTITY minscale_zoom15 "<MinScaleDenominator>12500</MinScaleDenominator>">
...
Licensed under the Creative Commons Attribution-Share Alike 3.0 Germany License 